Conventional wisdom these days is that in order for the Fed to bring inflation down, they are going to have to kneecap the economy. So with the Fed continuing to talk tough, it’s no wonder that a majority expect to see a US recession some time this year.
Wrong. As I’ve been explaining for a long time, inflation has already dropped significantly, and the economy remains reasonably healthy. In fact, a healthy economy and a vigilant Fed are a tried-and-true prescription for low inflation.
The facts back me up:
Real GDP growth for Q4/22 came in slightly above expectations (2.9% vs. 2.6%), and inflation, according to the very broad GDP deflator, was also slightly above expectations (3.5% vs. 3.2%), although it was substantially less than the 9.1% rate of just six months ago. Looking back at last year as a whole, real GDP shrank at a 1.1% annualized rate in the first half of the year, and grew at a 3.1% annualized rate in the second half of the year. Inflation, according to the GDP deflator (the most inclusive index we have), was running about 8.7% in the first half of the year, and 3.9% in the second half. So inflation fell by more than half over the course of the second half of the year, even as real growth almost tripled! So much for “conventional wisdom.”
Some charts to illustrate:

Chart #1 shows the quarterly annualized change in the GDP deflator, the broadest measure of inflation. Last year it peaked at 9.1% in the second quarter of last year, and fell to 3.5% in the fourth quarter. That’s a huge decline that I would wager most people are unaware of.

Chart #2 is also one that I believe most people are unaware of. The blue line represents the size of the US economy in inflation-adjusted terms (aka real growth). It’s plotted on a logarithmic axis which turns constant rates of growth into straight lines. The green trend line extrapolates where real GDP would be if the economy had continued its 3.1% trend growth rate that was in place from 1950 though 2007. The red trend line is the 2.2% annual growth trend that has been in place since the recovery started in 2009. What we see in recent years is a perfect example of Milton Friedman’s “plucked string” theory of economic growth. It says that the economy tends to grow at a steady rate unless or until it meets a disturbance (e.g., a recession); and once that disturbance has passed, the economy “snaps back” to its former trend line.
Voilá! The economy is growing at about 2.2% annual rate. Nothing special or surprising about that at all. But the real tragedy is that we could be growing at a much faster rate if our fiscal policy were sane instead of being dominated by burdensome regulations, green energy mandates, and egregious tax rates.
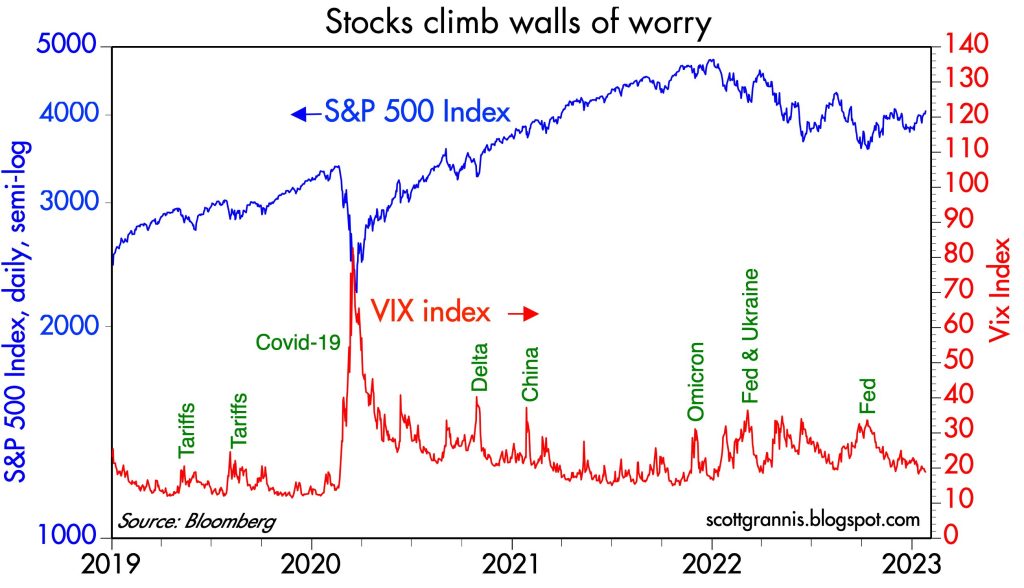
Chart #3 makes yet another appearance—it’s one of my favorites. It shows that when the market gets very nervous (as measured by a rise in the Vix index), the stock market tends to swoon. And when confidence returns and the Vix index drops, stocks tend to rally. Confidence these days is slowly returning and the stock market is moving higher.
Let’s hope this continues; let’s hope the Fed doesn’t feel compelled to squeeze the economy just because inflation is a little higher than they would like to see. The truth is that on the margin, inflation pressures are receding (and by some measures inflation is already back down to 2%—see Chart #1 in this post) and the best way to keep inflation low is to allow the economy to continue to grow while keeping interest rates high enough to keep the demand for money from plunging. A greater supply of goods and services, after all, will help absorb any extra money that is still sloshing around.
 About us
  Why us
  Information Services
  Trading Products
  Trading Accounts
  Trading Platform
  Education
  Contact us
  FAQs
FAQs
 27 January, 2023